基于k8s-prometheus-adapter实现 pod 的hpa 1 背景 在已部署的环境基础上,采用prometheus的指标来扩展HPA支持的指标,实现自定义指标水平扩展Pod
2 搭建
2.1 基础环境 kubernetes 1.10
prometheus-opreator
2.2 k8s 组件参数调整 2.2.1 kube-apiserver 在Master的API Server启动Aggregation层
1 2 3 4 5 6 7 8 9 10 11 12 13 14 15 --requestheader-extra-headers-prefix=X-Remote-Extra- --requestheader-group-headers=X-Remote-Group --requestheader-username-headers=X-Remote-User --requestheader-client-ca-file=/etc/kubernetes/pki/front-proxy-ca.crt --requestheader-allowed-names= --proxy-client-cert-file=/etc/kubernetes/pki/front-proxy-client.crt --proxy-client-key-file=/etc/kubernetes/pki/front-proxy-client.key
2.2.2 kube-controller-manager 配置kube-controller-manager服务中HPA的相关启动参数(可选配置)
1 2 3 4 5 6 7 8 --horizontal-pod-autoscaler-sync-period=10s --horizontal-pod-autoscaler-downscale-stabilization=1m0s --horizontal-pod-autoscaler-initial-readiness-delay=30s --horizontal-pod-autoscaler-tolerance=0.1
2.2.3 kubelet 修改各个节点位于/etc/systemd/system/kubelet.service.d/10-kubeadm.conf位置的kubelet配置文件,开启数据采集
1
2
3
4
5
6
7
KUBEADM_SYSTEMD_CONF=/etc/systemd/system/kubelet.service.d/10-kubeadm.conf sed -e "/cadvisor-port=0/d" -i "$KUBEADM_SYSTEMD_CONF " if ! grep -q "authentication-token-webhook=true" "$KUBEADM_SYSTEMD_CONF " ; then sed -e "s/--authorization-mode=Webhook/--authentication-token-webhook=true --authorization-mode=Webhook/" -i "$KUBEADM_SYSTEMD_CONF " fi systemctl daemon-reload systemctl restart kubelet
2.3 组件部署 2.3.1 新建namespace 1 kubectl create namespace custom-metrics
2.3.2 secret文件创建 创建访问api的secret文件configmap方便prometheus-adapter主应用使用
1 kubectl create secret generic cm-adapter-serving-certs --from-file=serving.crt=/etc/kubernetes/pki/front-proxy-client.crt --from-file=serving.key=/etc/kubernetes/pki/front-proxy-client.key -n custom-metrics
2.3.3 prometheus-adapter创建 其yaml文件 主要来源于prometheus-adapter,只针对deployment做了小部分修改,内容如下
1
2
3
4
5
6
7
8
9
10
11
12
13
14
15
16
17
18
19
20
21
22
23
24
25
26
27
28
29
30
31
32
33
34
35
36
37
38
39
40
41
42
43
44
45
46
47
48
49
50
51
apiVersion: apps/v1 kind: Deployment metadata: labels: app: custom-metrics-apiserver name: custom-metrics-apiserver namespace: custom-metrics spec: replicas: 1 selector: matchLabels: app: custom-metrics-apiserver template: metadata: labels: app: custom-metrics-apiserver name: custom-metrics-apiserver spec: serviceAccountName: custom-metrics-apiserver containers: - name: custom-metrics-apiserver image: k8s-prometheus-adapter-amd64:v0.5.0 args: - --secure-port=6443 - --tls-cert-file=/var/run/serving-cert/serving.crt - --tls-private-key-file=/var/run/serving-cert/serving.key - --logtostderr=true - --prometheus-url=http://prometheus:9090/ - --metrics-relist-interval=1m - --v=10 - --config=/etc/adapter/config.yaml ports: - containerPort: 6443 volumeMounts: - mountPath: /var/run/serving-cert name: volume-serving-cert readOnly: true - mountPath: /etc/adapter/ name: config readOnly: true - mountPath: /tmp name: tmp-vol volumes: - name: volume-serving-cert secret: secretName: cm-adapter-serving-certs - name: config configMap: name: adapter-config - name: tmp-vol emptyDir: {}
在此文件夹下执行kubectl create -f . -n custom-metrics完成创建prometheus-adapter
2.3.3 确认prometheus-adapter是否正常
查看prometheus-adapter Pod健康状态
1
2
3
# kubectl get pod -n custom-metrics NAME READY STATUS RESTARTS AGE custom-metrics-apiserver-584d7c44f7-bg7hn 1/1 Running 0 59m
确认这个custom.metrics.k8s.io/v1beta1 api存在以及可访问
1
2
3
4
5
6
7
8
9
10
11
12
# kubectl api-versions ... autoscaling/v1 autoscaling/v2beta1 batch/v1 batch/v1beta1 certificates.k8s.io/v1beta1 custom.metrics.k8s.io/v1beta1 ... # kubectl get --raw "/apis/custom.metrics.k8s.io/v1beta1" 能正常返回Json数据串
3 HPA验证 3.1 创建验证APP 部署应用程序, 它会在HTTP URL“/metrics”路径提供名为http_requests_total的指标值
1
2
3
4
5
6
7
8
9
10
11
12
13
14
15
16
17
18
19
20
21
22
23
24
25
26
27
28
29
30
31
32
33
34
35
36
37
38
39
40
41
42
43
44
45
46
47
48
49
50
51
52
53
54
55
56
57
58
59
60
apiVersion: apps/v1 kind: Deployment metadata: name: sample-app namespace: custom-metrics labels: app: sample-app spec: replicas: 1 selector: matchLabels: app: sample-app template: metadata: labels: app: sample-app spec: containers: - image: autoscale-demo:v0.1.2 imagePullPolicy: IfNotPresent name: metrics-provider ports: - name: http containerPort: 8080 --- apiVersion: v1 kind: Service metadata: name: sample-app namespace: custom-metrics labels: app: sample-app spec: type: NodePort ports: - name: http port: 80 targetPort: 8080 selector: app: sample-app --- apiVersion: monitoring.coreos.com/v1 kind: ServiceMonitor metadata: name: sample-app namespace: custom-metrics labels: application: sample-app release: c2-monitor spec: selector: matchLabels: app: sample-app namespaceSelector: matchNames: - custom-metrics endpoints: - port: http
部署成功之后, 可以在应用的URL“/metrics”中查看指标http_requests_total的值
1
2
# wget -q -O- http://127.0.0.1:31804/ Hello! My name is sample-app-58c548bb76-qvnpk. I have served 21472 requests so far.
可以通过查看自定义Metrics Server提供的URL“custom.metrics.k8s.io/v1beta1”查看Pod的指标是否已经被成功采集, 并能够通过聚合API进行查询
1
2
# kubectl get --raw "/apis/custom.metrics.k8s.io/v1beta1/namespaces/custom-metrics/pods/*/http_requests?selector=app%3Dsample-app" {"kind":"MetricValueList","apiVersion":"custom.metrics.k8s.io/v1beta1","metadata":{"selfLink":"/apis/custom.metrics.k8s.io/v1beta1/namespaces/custom-metrics/pods/%2A/http_requests"},"items":[{"describedObject":{"kind":"Pod","namespace":"custom-metrics","name":"sample-app-58c548bb76-qvnpk","apiVersion":"/v1"},"metricName":"http_requests","timestamp":"2019-11-06T08:52:06Z","value":"33m"}]}
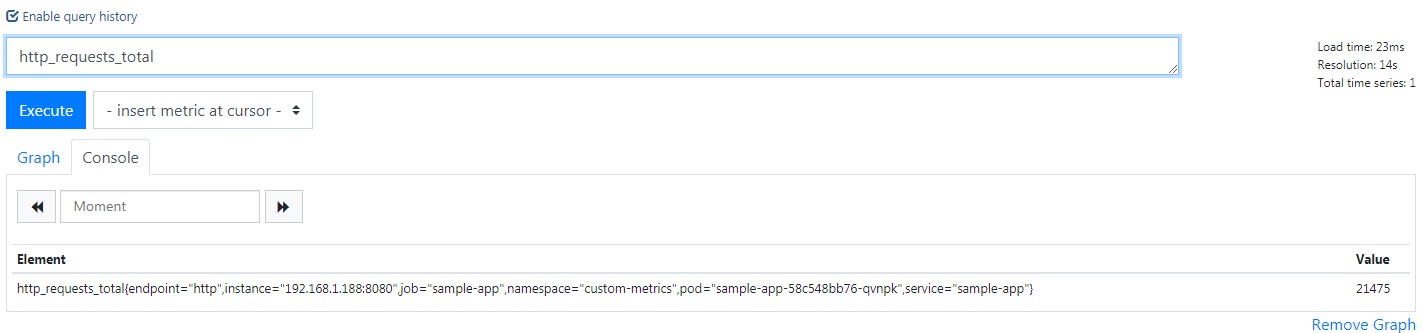
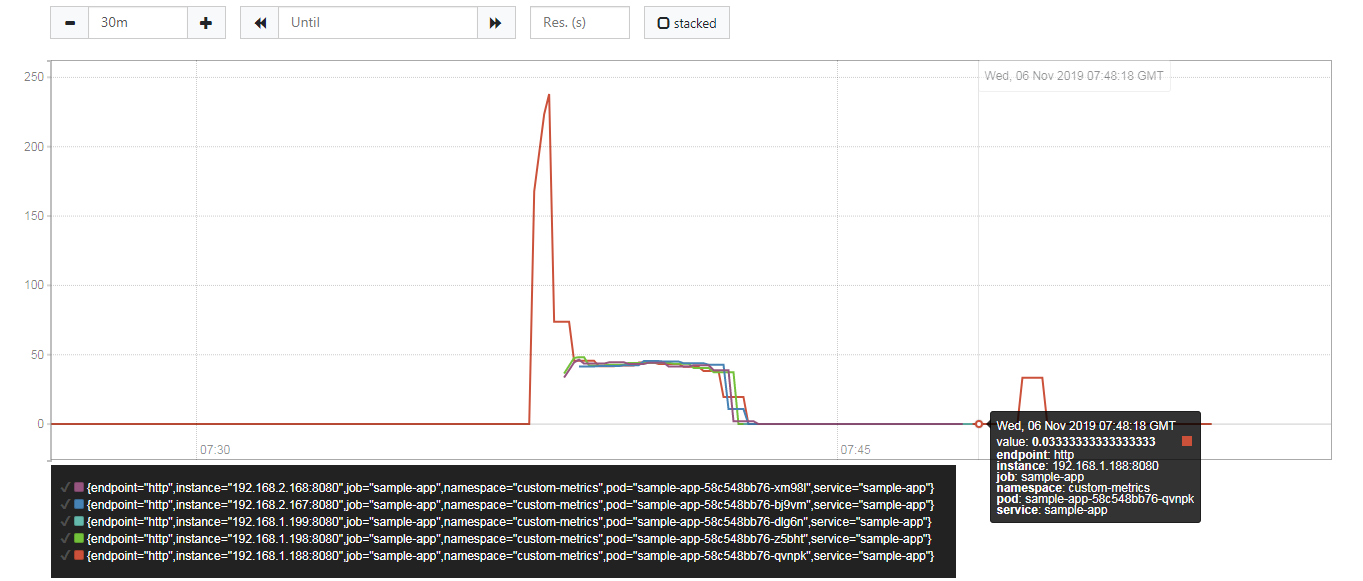
并且由于配置了ServiceMonitor所以可以在prometheus中查询对应的指标值
3.2 创建HPA对象 创建一个HorizontalPodAutoscaler对象, 用于为HPA控制器提供用户期望的自动扩缩容配置
1
2
3
4
5
6
7
8
9
10
11
12
13
14
15
16
17
apiVersion: autoscaling/v2beta1 kind: HorizontalPodAutoscaler metadata: name: sample-app namespace: custom-metrics spec: scaleTargetRef: apiVersion: apps/v1 kind: Deployment name: sample-app minReplicas: 1 maxReplicas: 5 metrics: - type: Pods pods: metricName: http_requests targetAverageValue: 500m
关键配置如下:
scaleTargetRef: 设置HPA的作用对象为之前部署的Deployment“sample-app”
type=Pods: 设置指标类型为Pods, 表示从Pod获取指标数据
metricName=http_requests: 将指标的名称设置为“http_requests”, 是自定义Metrics Server将应用程序提供的指标“http_requests_total”经过计算转换成的一个新比率值, 即
targetAverageValue: 将指标http_requests的目标值设置为500m, 类型为AverageValue, 表示基于全部Pod副本数据计算平均值。 目标Pod副本数量将使用公式“http_requests当前值/500m”进行计算
minReplicas和maxReplicas: 将扩缩容区间设置为1~10( 单位是Pod副本数)
3.3 验证 对应用的服务地址发起HTTP访问请求, 验证HPA自动扩容机制。可以脚本对应用进行压力测试,并使其自动扩缩容
1 for i in {1..100000}; do wget -q -O- 169.169.43.252 > /dev/null; done
测试结果如下,在循环请求中副本数由1个变成了5个;在终止请求后,副本数恢复到1个。
4 参考 https://blog.csdn.net/qq_21816375/article/details/82662897
[https://github.com/kubeguide/K8sDefinitiveGuide-V4-Sourcecode/blob/master/Chapter3/3.12.2%20hpa-v2.yaml] (https://github.com/kubeguide/K8sDefinitiveGuide-V4-Sourcecode/blob/master/Chapter3/3.12.2 hpa-v2.yaml)
https://github.com/DirectXMan12/k8s-prometheus-adapter/tree/master/deploy/manifests